
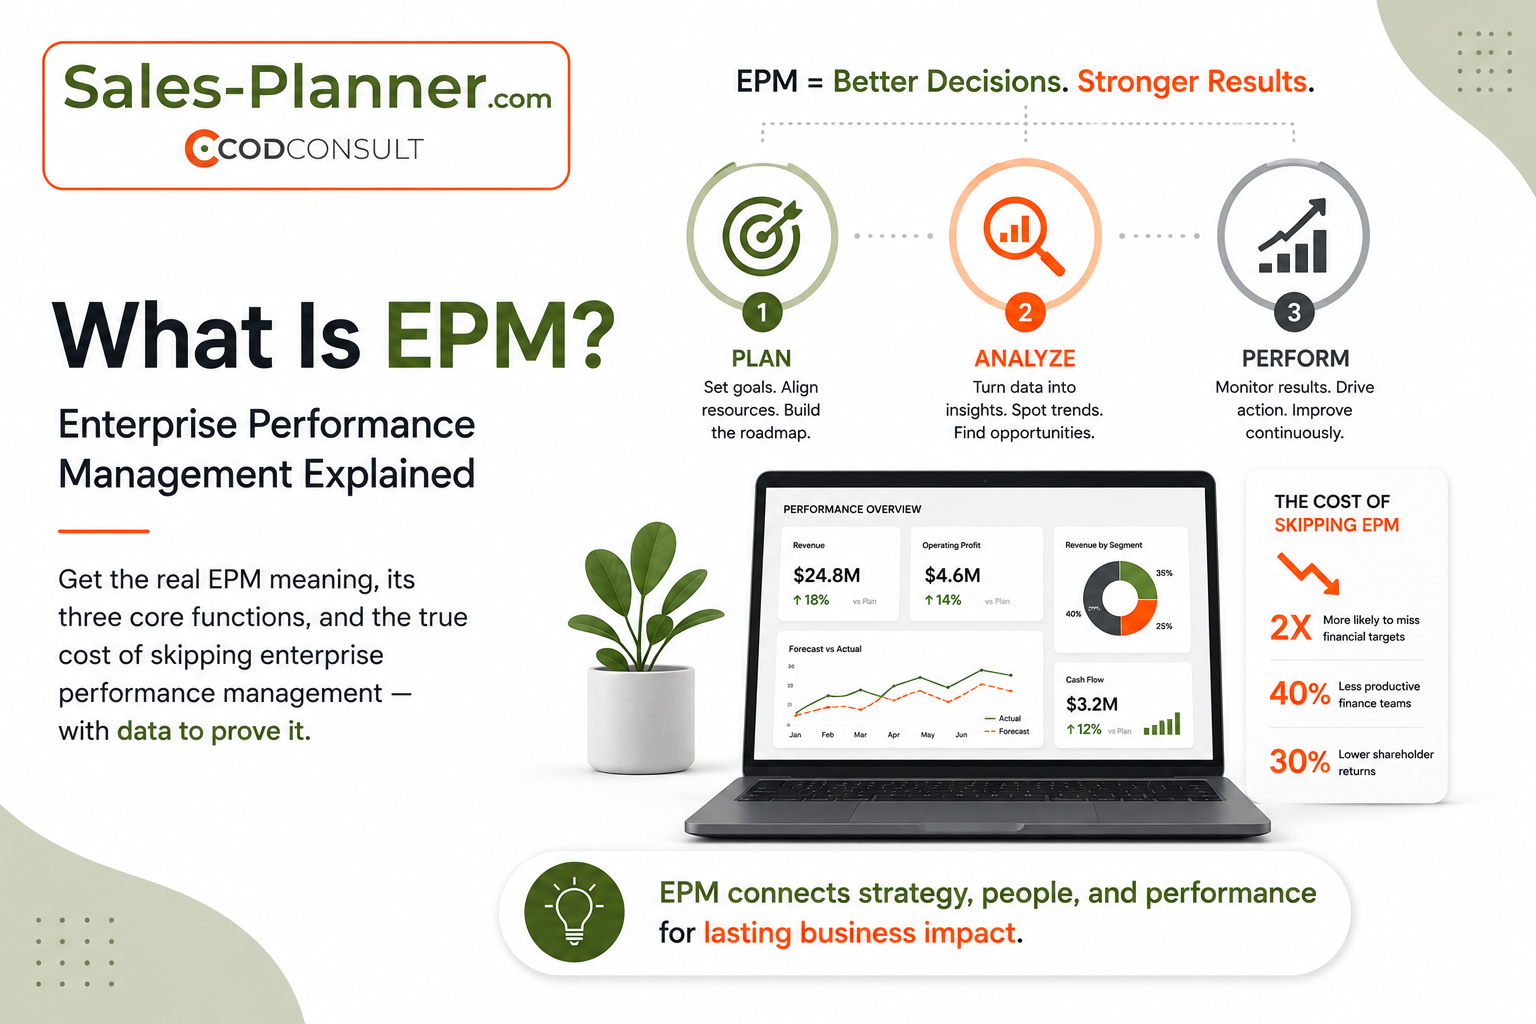
Some terms seem simple, but they carry a deeper meaning for your sales business and IT company. For example, EPM. You searched "EPM meaning" because someone in a meeting used the term and nobody asked what it meant. Here's the answer, then the math behind why it matters.
EPM, or Enterprise Performance Management, is the process of connecting a company's strategy to its actual numbers, planning, budgeting, forecasting, and reporting, all pulled into one system so leaders can see where the business stands and fix it before it drifts off target. That's the full definition.
Everything below is why it's worth your attention.
Why "EPM Meaning" Isn't as Simple as One Line
EPM is not a vague management philosophy or a trend. It is the systemic framework that takes operational data from your transactional engines and transforms it into predictive, actionable direction.
Ask five vendors what EPM is, and you'll get five answers dressed up in different jargon. Strip the noise, and EPM does three jobs:
1. Plan: set targets for revenue, cost, and headcount. 2. Track and measure what's actually happening against that plan. 3. Correct: adjust before a small miss becomes a big one.
Strategy Formula:
Expected Return = (Historical Performance × Driver Coefficient) ± Scenario Volatility Margin
Do this in spreadsheets, and you're doing EPM manually. Do it with software, and you're using enterprise performance management systems and software — the same job, minus the version-control chaos and the Friday night spent reconciling three different files that all claim to be "final."
The Operational Mechanics of Modern Solutions
To fix this, companies run to performance management solutions. These are not just storage facilities for data. They are live processing layers that execute three core functions across your organisation:
1. Connected Financial and Operational Planning
Traditional planning is backwards-looking. A functional system uses driver-based planning. If your sales pipeline drops by 12% in Region A, a connected system automatically recalculates the inventory requirements, adjusts manufacturing procurement pipelines, and flags the cash flow variance for the CFO within minutes, not at the next quarterly review.
2. Automated Financial Consolidation and Close
If your accounting team spends two weeks of every month manually reconciling intercompany eliminations and converting currencies across foreign entities, they are costing you money. High-performance enterprise performance management solutions cut this close cycle down from weeks to a few days by automating standard adjustments and preserving a completely transparent audit trail.
3. Real-Time Scenario Modelling
What happens if your primary material costs spike by 15% next month? Or if your customer acquisition cost increases by 22%? Instead of running manual formulas in a fragile spreadsheet, modern platforms use predictive analytics to run multiple "what-if" models across thousands of operational variables simultaneously.
Scenario Vector:
Net Margin = (Volume × Price) − [Fixed Cost + (Variable Input Cost × Volatility Index)]
Systems vs. Tools: Stop Buying Fragmented Software
Let's get clear on definitions because mixing them up results in wasted tech spend.
- Enterprise performance management tools are point solutions. They handle an isolated task, like a specific dashboard interface or a basic reporting module. They are features masquerading as systems. - Performance management software is comprehensive infrastructure. They integrate every disparate segment of your data into a single, unified truth foundation.
If you are buying isolated tools, you are just building new digital silos. You are paying for software subscriptions while still forcing human employees to act as manual data bridges between platforms. It doesn't scale, and it doesn't fix the core visibility problem.
Let's Do the Math: The Cost of Stagnation
Let's look at the actual numbers. If your enterprise brings in €50,000,000 in annual revenue and your forecasting cycle takes 20 days with a 15% error margin, your capital misallocation cost is dragging down your bottom line.
| Metric | Traditional Manual Methods | Unified EPM Systems | Efficiency Gain | |---|---|---|---| | Financial Close Cycle | 14–21 Days | 3–5 Days | ~75% Time Reduction | | Forecast Accuracy Margin | ±15% Variance | ±3% Variance | 5× Predictability Improvement | | Rolling Forecast Cycle | Quarterly / Annual | Continuous / Monthly | Real-time Resource Pivot | | Data Reconciling Hours | 120+ Hours / Month | Automated | 100% Redundancy Elimination |
Think about the direct resource cost. If five senior analysts spend 40 hours each month just cleaning data and copying rows between systems, you are spending thousands of euros on human calculators instead of strategic minds.
Wasted Capital Equation:
(5 Analysts × 40 Hours × €75/Hour) × 12 Months = €180,000 / Year on Manual Data Moving
That is €180,000 gone annually just to assemble reports that are already outdated by the time they hit the executive table. A true system reclaims that resource immediately.
Implementing EPM Without the Jargon
If you are going to transition to integrated performance management, you need to do it methodically. Order matters. Skip a step, and you will end up with an expensive software stack that nobody uses.
1. Audit the Data Pipeline — Locate where your core transactional, operational, and customer data lives. Clean up data formatting inconsistencies at the root source before trying to connect them to any platform. 2. Map Key Operational Drivers — Isolate the exact metrics that dictate your revenue and margin outcomes. Do not track 200 generic metrics; define the core 5 to 10 drivers that actually move the needle for your business model. 3. Deploy Centralised Systems — Implement comprehensive software that integrates directly with your ERP, CRM, and payroll engines. Build continuous, automated ingestion pipelines to eliminate human manual entry. 4. Execute Rolling Forecasts — Transition away from rigid, static annual budgets. Deploy rolling 12-month or 24-month forecasting models that adapt automatically to live market shifts and actual pipeline realisation.
Start Planning on Real Numbers With Sales Planner
Knowing the EPM meaning is good. Knowing what your numbers mean for your next operational move is how you dominate your market. If your sales plan and your performance numbers live in two different worlds, you don't have a planning process; you have two teams hoping they agree by accident. Get a clean, automated, single source of performance metrics that drives your organisation forward.
Sales-Planner connects planning and performance management in one place, so quotas, forecasts, and actuals stop living in separate spreadsheets and start talking to each other. No more reconciling three "final" versions before a Monday meeting. No more finding out you missed the number three weeks after it happened.
Book a free planning audit or talk to a planning strategist today. Bring your last quarter's spreadsheet. We'll show you the math.
Go from reading to doing — in 2 weeks.
Try the planning tool for free, or talk to Andreas about your specific situation.
The playbooks Andreas only shares with paying clients — straight to your inbox.
Four letters a year. Each one packed with frameworks, numbers and lessons from live enterprise engagements. No marketing fluff, no generic sales coaching.
- 1 deep-dive framework
Ready to use — from pipeline reviews to quota logic.
- 1 live lesson
What worked (or didn't) this week on a 7-figure engagement.
- 1 RevOps tool
One we actually pay for — with an honest verdict.
- No spam, ever
- 1-click unsubscribe
- GDPR-compliant · EU-hosted
Andreas writes about B2B sales, RevOps, and scaling enterprise sales teams drawing from 20 years of experience.